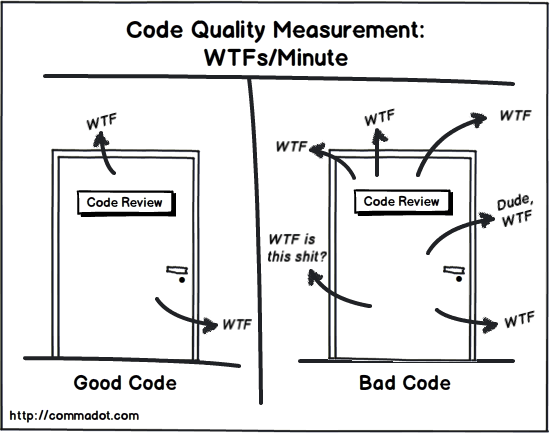
When writing code, developers often overlook or disregard the importance of structure and readability. In some cases, increased code readability will result in minor performance penalties (let’s be honest; these cases will be rare). The benefits of improved maintainability will save us time and frustration in the long run. In theory, it should be easy to spot poorly structured code; just listen to your reviewer’s WTFs/M 😊
Figure 1 Code quality measurement
There are many tools, metrics, and processes available to us for improving quality. One such metric is called the Maintainability Index that represents how sustainable a piece of software is (i.e., how easy it is to support and change). It takes into account several other metrics multiplied by their overall impact weights and provides a single value indicator. Paul Oman and Jack Hagemeister proposed the Maintainability Index in 1992 (Oman Paul, Jack Hagemeister, 1992) after scanning and rating a large number of C and Pascal systems written in the late ‘80s. Microsoft simplified it by introducing an adjusted version of the original formula, by removing code comments from the original equation and adding simplified thresholds for resulting scores, which is the version we’ll discuss here:
The result is in one of three ranges proposed by Microsoft:
0-9 – Red; unmaintainable code
10-19 – Yellow; possible problems
20-100 – Green; well-written and maintainable
Because this is calculated based on code syntax, it doesn’t offer insights into how to read the code (e.g., reasonable variable names). It’s better to treat it as a guideline that can point us to problematic locations in our solution. In the formula, we can see that maintainability score is calculated by using three additional metrics:
Halstead Volume
Focuses on the readability of the code by providing us information about amounts of operators and operands needed for its execution. It’s part of many other Halstead metrics introduced by Maurice Howard Halstead in 1977 (Halstead, 1977). It helps us understand how much information the reader of code has to absorb to understand its meaning. Halstead volume is calculated by using the Halstead Length (sum of all operators and operand occurrences) and Halstead Vocabulary (sum of distinct operator and operand occurrences). Because a lower score is ideal, we should target for concise and shorter pieces of code, thus avoiding noise.
Cyclomatic Complexity
A score calculated as the sum of linearly independent paths in a section of code. Thomas J. McCabe developed this metric in 1976 (McCabe, 1976) to represent the control flow of a program. Control flow depicts a program with a graph consisting of nodes and edges. Each node can be interpreted as a program command, while edges represent connections or paths between those commands. The resulting score identifies the parts of code that need to be covered by unit tests. The score also helps testers determine independent path executions; testers can then target having the number of test cases equal to the cyclomatic complexity score. This score defaults to 1, and we should aim to be as low as possible, avoiding too many branching and logic inside a single code piece.
Lines of Code
This metric is the total number of executable code lines while ignoring comments and empty lines. Like the first two measurements, the lower score is better, thus preventing adding too much logic into one place.
How to calculate this metric
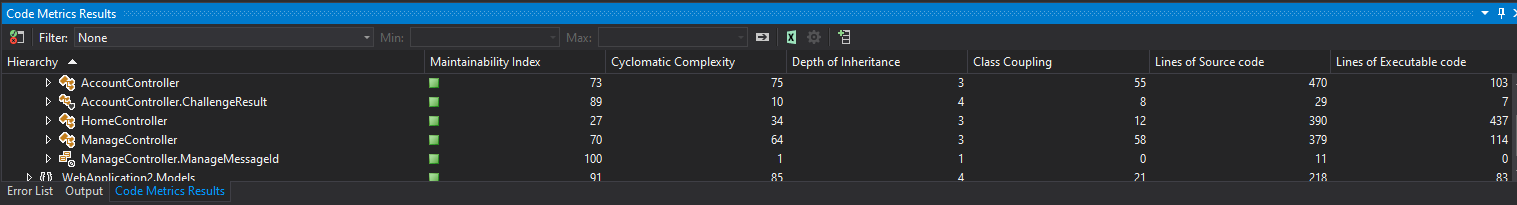
We’ve been able to compute the Maintainability Index in Visual Studio since 2007. You can access the Calculate Code Metrics command tool in the Analyze menu. After the scan finishes, you can see how your code is holding up:
Figure 2 Code metrics in Visual Studio
I’ve found this tool useful in identifying parts of code that may need revisiting and refactoring. It also provides a complete summary of other metrics, like class coupling and depth of inheritance. Although it offers a lot of information, there is one thing I don’t like about it:
It’s report driven. Every time you want to see the results, you need to execute the scan command — this can get quite cumbersome after a while. This is where I got the idea to create an extension that would add an indicator next to a method declaration, telling us at a glance the maintainability score. After a couple of months, I finished it and published it on the marketplace for Visual Studio extensions as Code Maintainability.
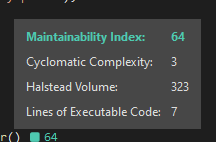
When you install the extension, you’ll notice a small square with the maintainability score next to it:
Figure 3 Extension indicator
Hovering over the score with a mouse cursor provides more information about the parameters used in the calculations:
Figure 4 Tooltip displayed on mouse hover
This way, you can easily track the maintainability index while you type, or just by scrolling the code in the editor. If you find this indicator distracting, you can always change its mode (to display the only indicator without an actual score) and location (on the left or right side of the method declaration).
What’s next?
I have a couple of ideas for the future. Currently, the extension only scans method declarations, but it would be useful for it to cover class constructors as well. I also received feedback about editing threshold values; it would be nice to manage that in settings as well so that we can control how strict the maintainability policy is.
Like what you have seen so far? Give it a go and let me know what you think. Feel free to share your comments, feature requests, and critics on ognjen.babic@exlrt.com
This website uses cookies to ensure proper website functionality and to analyze traffic on our website. These cookies help us understand how visitors interact with our pages so we can continuously improve our services.